
OpenTelemetry es una serie de herramientas, API y SDK que nos permite generar, recopilar y exportar datos de telemetría (métricas, registros y trazas) para analizar el comportamiento y rendimiento de una aplicación.
En este ejemplo podemos ver como poner en marcha un proyecto sencillo: Open Telemetry en .NET
Y a continuación os muestro como añadir la parte de exportación a Prometheus, Jaegger y métricas para OTEL Collector.

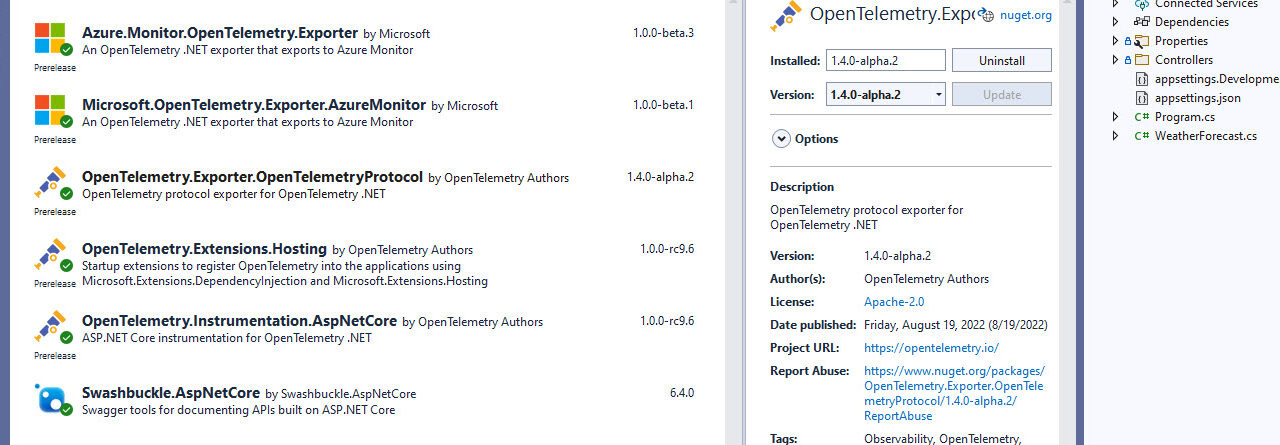
Como podéis observar se trata de un ejemplo estándar de una Web API de .NET6.
Al que le hemos añadido referencias de Open Telemetry (entra en dependencias para ver cuales usamos, más abajo os pongo enlace al ejemplo).
Y este es el código que debemos añadir:
using OpenTelemetry.Metrics;
using OpenTelemetry.Resources;
using OpenTelemetry.Trace;

var builder = WebApplication.CreateBuilder(args);

// Add services to the container.

builder.Services.AddControllers();
// Learn more about configuring Swagger/OpenAPI at https://aka.ms/aspnetcore/swashbuckle
builder.Services.AddEndpointsApiExplorer();
builder.Services.AddSwaggerGen();

builder.Services.AddOpenTelemetry();


builder.Services.AddOpenTelemetry()
    .WithTracing(builder => builder
        .AddAspNetCoreInstrumentation()
        .AddConsoleExporter()
        .AddOtlpExporter(opts => { opts.Endpoint = new Uri("http://otelcollector:4317"); }))
    .WithMetrics(builder => builder
        .AddAspNetCoreInstrumentation()
        .AddConsoleExporter()
        .AddOtlpExporter((exporterOptions, readerOptions) =>
        {
            exporterOptions.Endpoint = new Uri("http://otelcollector:4317");
            readerOptions.PeriodicExportingMetricReaderOptions.ExportIntervalMilliseconds = 5000;
        })
        .AddView("processor.lag", new ExplicitBucketHistogramConfiguration()
        {
            Boundaries = new double[] { 0, 500, 1000, 2500, 5000, 7500, 10000, 25000, 50000 },
            RecordMinMax = false
        })
        .ConfigureResource(resource => resource.AddService("otellocollectorsample")));

var app = builder.Build();

// Configure the HTTP request pipeline.
if (app.Environment.IsDevelopment())
{
    app.UseSwagger();
    app.UseSwaggerUI();
}

app.UseHttpsRedirection();

app.UseAuthorization();

app.MapControllers();

app.Run();
El fichero de docker-compose:
version: "3.9"
services:
  app:
    build:
      context: ./
      dockerfile: ./Dockerfile
    depends_on:
      - otelcollector
    environment:
      - OTEL_EXPORTER_OTLP_ENDPOINT=http://otelcollector:4317
      - OTEL_SERVICE_NAME=otellocollectorsample
      - OTEL_METRIC_EXPORT_INTERVAL=5000
      - ASPNETCORE_ENVIRONMENT=Development
      - ASPNETCORE_URLS=https://+:443;http://+:80
    ports:
      - "5001:80"
      - "5101:443"
    volumes:
      - ${APPDATA}/Microsoft/UserSecrets:/root/.microsoft/usersecrets:ro
      - ${APPDATA}/ASP.NET/Https:/root/.aspnet/https:ro
  otelcollector:
    image: otel/opentelemetry-collector-contrib
    command: ["--config=/etc/otel-collector-config.yml"]
    ports:
      - "8889:8889"
      - "13133:13133"
      - "4317:4317"
      - "4318:4318"
      - "55679:55679"
    volumes:
      - //var/run/docker.sock:/var/run/docker.sock
      - ./configs/otel-collector-config.yml:/etc/otel-collector-config.yml
    depends_on:
      - jaeger
  jaeger:
    image: jaegertracing/all-in-one:latest
    ports:
      - "14250:14250"
      - "14268:14268"
      - "6831:6831/udp"
      - "16686:16686"
      - "16685:16685"
  prometheus:
    image: prom/prometheus:latest
    volumes:
      - ./configs/prometheus.yml:/etc/prometheus/prometheus.yml
    ports:
      - "9090:9090"
    depends_on:
      - otelcollector
Y las configuraciones que tenemos en la carpeta config del las fuentes contiene varios yaml para configurar prometheus y jaegger, por ejemplo:
receivers:
  otlp:
    protocols:
      grpc:

exporters:
  jaeger:
    endpoint: jaeger:14250
    tls:
      insecure: true
  prometheus:
    endpoint: "0.0.0.0:8889"

processors:
  batch:

service:
  pipelines:
    traces:
      receivers: [otlp]
      processors: [batch]
      exporters: [jaeger]
    metrics:
      receivers: [otlp]
      processors: [batch]
      exporters: [prometheus]
Cargamos nuestra API y lanzamos unos cuantos gets:

Entramos en http://localhost:16686 para ver que Jaeger esta funcionando:

Entramos en http://localhost:9090/ para ver que Prometheus esta funcionando:

Entramos en http://localhost:3000/ para ver que Grafana esta funcionando (usuario admin y password admin):


Y como puedes obsevar ya tienes los contenedores integrados en tu aplicación para que puedas testear las herramientas en local.